Infographic Guest Post
You may already have a blog, or perhaps you’re starting a new one, so I want to share with you some ideas on how to use infographics to make that blog more awesome than it already is.
Not only that, but you can share your infographic with other sites, who will surely agree to link back to your site.
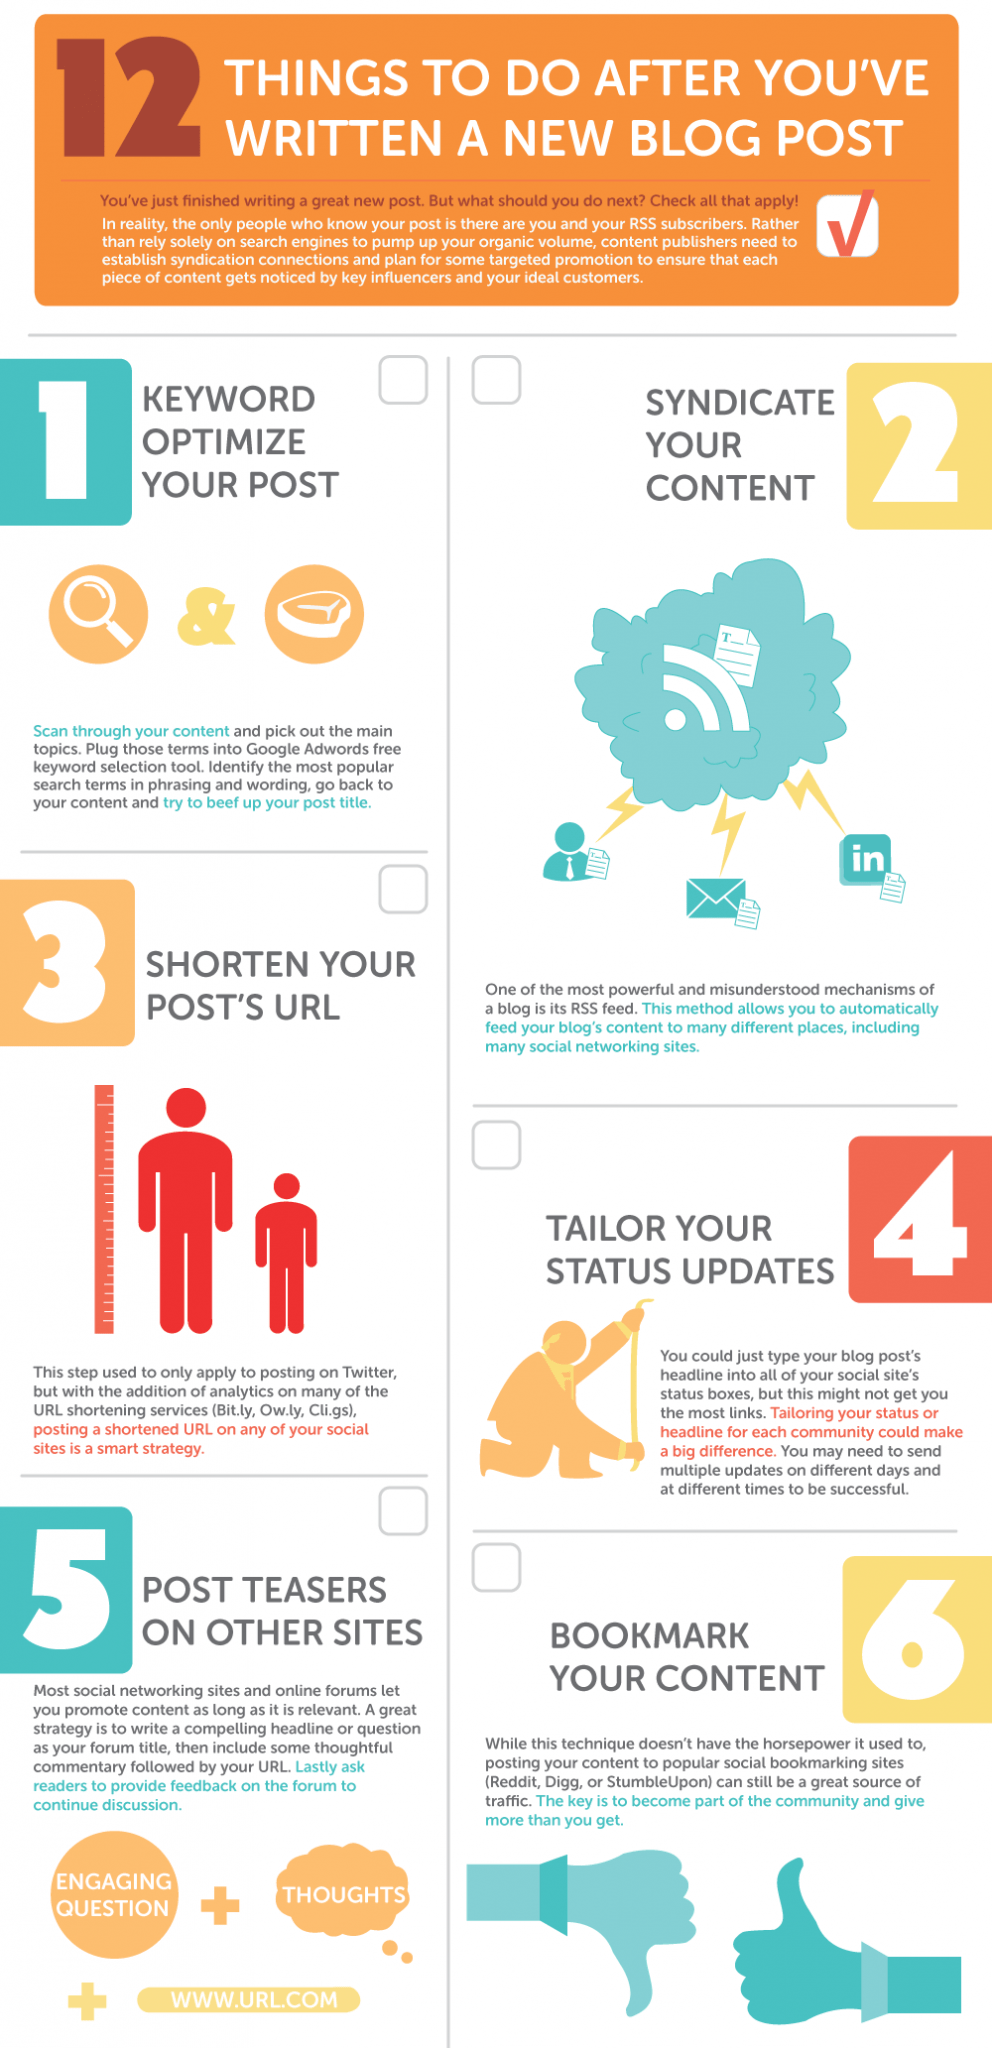
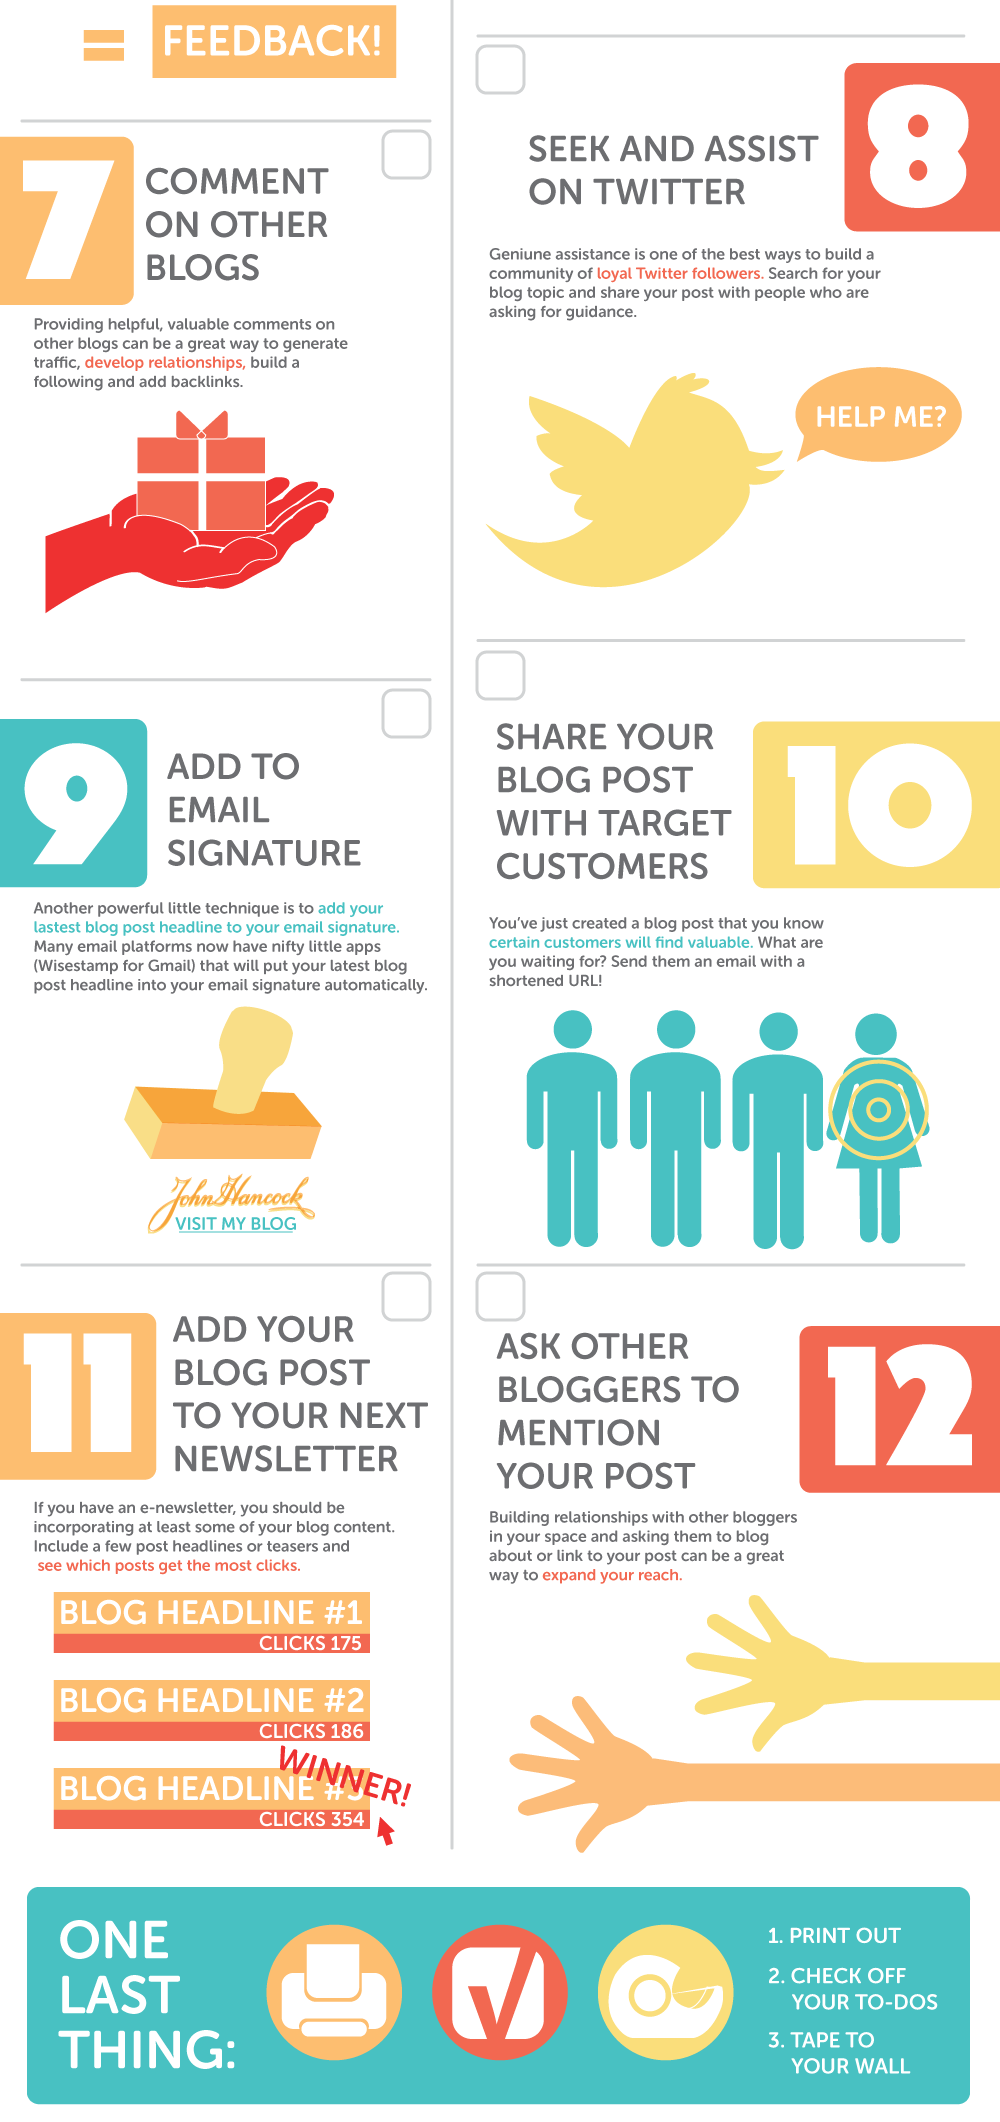
See an example of an infographic
Why you should know how to use infographics
There are three dominant learning styles: visual, aural, and kinesthetic. Some people learn by seeing things, some learn by hearing things, and others learn through physical actions. However, the majority of learners fall into the visual learning category.
Visual learners access information through graphs, charts, reading, or writing.
Auditory learners tend to prefer hearing things to learn better.
Kinesthetic learners take a hands-on approach to learning and are in the rare category of people who actually enjoy working in groups.
While most of us are a blend of these three, for the purpose of this post, I will stick to visual learners because they make up 65% of the population. And if you know how to use infographics effectively, those people will find you to be a whopping 43% more persuasive!
That is a huge number of people in a digital age where it can be challenging to get anyone’s attention.
Optimize Infographics for SEO
Search engine optimization — also known as SEO for short — is a fundamental pillar in modern internet marketing. It helps make your brand visible to millions of search engine users who could be seeking what you offer.
However, written content and infographics require different optimization techniques for SEO. Since infographics are essentially images, you need to focus on three key elements for optimization: the file name, alt text, and meta description.
- File Name – Since images can’t contain crawlable text for search engine bots, they use the file name instead to determine what it’s all about. Remember to use fewer words while being as descriptive as possible.
- Alt Text – While the file name is crucial for crawlers, the alt text or alt tag is aligned more to the reader’s needs. It’s the line of text that displays when the image fails to load properly, and it must provide human readers with some context on what an infographic is about. Whatever you do, you should avoid stuffing SEO keywords into alt tags.
- Meta Description – Lastly, the meta description is the paragraph that describes your content on the search engine results page. This can be modified with a tool like WP Meta SEO. Some of the rules you need to remember are to be straightforward, include calls to action, and limit the number of characters to 160 or less.
Choosing an Infographic Design Tool:
While there is the option to hire a professional designer to create your infographic for you, it’s worth considering the option of using one of the main design tools that are now available to create your own, especially if you are guest posting on a budget. There are several sites and apps that you can use to design your infographic, but the following are the most highly recommended:
Canva:
This design tool has become a huge hit for both businesses and individuals. It comes with several pre-designed, professional infographic templates that you can work with to create your infographic. You can easily change all elements of the template to suit your needs including the colors, graphics, fonts, and more.
Venngage Infographics:
With just a few clicks, this tool can help you create interesting and professional-looking infographics for your guest posts. It offers over five hundred professionally designed templates for you to choose from and is seriously easy to use.
Piktochart:
The easy-to-use infographic creation feature allows you to create high-quality infographics even if you do not have any design skills. There are some decent templates available on the free plan that you can get started with, or upgrade to one of their paid plans to get access to even more premium infographic templates.
Fiverr:
Fiverr is a great choice if you’d rather outsource infographic design than do it yourself. Here you can find many designers who can put together an infographic for you regardless of your budget. You can find services for as little as $5 or pay more to get better quality.
The Infographic Blog Post Template
If you have an infographic to share, the goal of your blog post is to take data and organize it, both visually and through text. The biggest mistake bloggers make when posting infographics is making their readers manually write down any important stats they want to remember or share.
This is useful for infographics that have a long format.
- Be Consistent with Your Brand Image. Versatility is a key advantage of infographic blog post. …
- Optimize Infographics for SEO. …
- Set a Content Goal for the Entire Post. …
- Try Something New. …
- Conclusion.
The infographic also explores some different ways to keep your reader’s attention throughout the post:
- Write with personality. No one likes a boring or robotic blog post, let your personality drive the post!
- Include interesting/shocking statistics and facts. …
- Ask your readers questions throughout the post. …
- Offer value.
An infographic example is a visual representation of information. Infographics examples include a variety of elements, such as images, icons, text, charts, and diagrams to convey messages at a glance.
See an infographic example at the beginning of this page.
Infographics (a clipped compound of “information” and “graphics”) are graphic visual representations of information, data, or knowledge intended to present information quickly and clearly. They can improve cognition by utilizing graphics to enhance the human visual system’s ability to see patterns and trends.
Here are 6 essential elements to include when creating your very own branded infographic:
- Descriptive Title and Subheads. …
- Informative Statistics. …
- Bold, Thematically Appropriate Color Scheme. …
- Eye-Catching Graphics. …
- Clearly Organized, Sequential Story. …
- Specially Formatted Facts.